
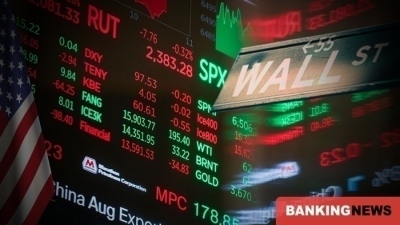
After an unprecedented rally, gold has recorded its largest drop in 12 years.
October 21, 2025, will go down in history as the Great Heist.
While global markets appeared relatively calm, the metals market — and especially gold — experienced chaos, with movements described by Goldman Sachs as “bizarre.”
The Goldman Momentum Pair Index collapsed by 5%, with the Momentum Long index dropping 3% and Momentum Short surging 2%.
Yet even those moves paled in comparison to the crash in gold, which plunged as much as 6.3% — a 5-sigma event marking the sharpest fall in over a decade — while spot silver sank 8.7%.
According to Goldman, “the gold chart looked like a collapsing meme stock.”
Gold-mining stocks also tumbled sharply, with major producers such as Barrick Mining, Newmont, and Agnico Eagle Mines falling by more than 8%.

It all came suddenly
The drop came out of nowhere, halting a powerful rally that had pushed both metals to record highs the previous week.
Gold had soared on bets that the U.S. Federal Reserve would deliver at least one major rate cut by the end of the year, and due to the ongoing “debasement trade”, in which investors flee government debt and currencies to shield themselves from runaway fiscal deficits.
However, since none of those fundamentals have changed — and with the debasement cycle only just beginning — the upward trend is likely to resume soon. U.S. total debt has just reached a record $37.98 trillion, rising by $10 trillion in less than five years.

What happened
Adam Gillard, a commodities specialist at Goldman Sachs, explained that gold first moved lower during China’s trading session (with total open interest on the SHFE dropping by 1%) before triggering stop losses as London and U.S. markets opened.
What’s most remarkable, Gillard said, is that there was “no apparent cause” for the crash; though, rarely during gold’s upward trajectory was any move linked to a specific “headline.”
Instead, it was a continuation of the debasement theme, making it difficult to pinpoint a single trigger for the correction.
Gillard’s best explanation for the largest percentage move in a decade is simple: positioning. The market had just come off nine consecutive weeks of gains.
Goldman’s shocking findings
On days when gold rose about $50 an ounce, “we barely got any questions,” Gillard noted.
Gold had become the favorite long macro trade among Goldman’s clients; in multiple client surveys, over 80% expected the price to rise further by year-end (including Goldman’s own traders).
The bank also observed an increasing number of non-commodity accounts taking positions; not surprising, given the surge in demand for physical gold.
All this made a correction virtually inevitable, according to Goldman (and its partners at SpotGamma, who had warned that such a pullback was coming).
Still, similar to the recent collapse of the overleveraged crypto sector two weeks ago, Goldman believes that as gold climbed higher, more investors were left out but wanted in — meaning the bank expects fresh inflows once signs of stability emerge. For that to happen, however, the $4,000/oz level must hold.
Here are the three shocking charts that explain how we got here:
ETF Volume: The ease of using ETFs for fast exposure to gold was fully on display. At current closing prices, GLD accounts for 8% of total U.S. ETF trading volume — the highest share ever in Goldman’s data. Flows at Goldman’s ETF desk were clearly selling-heavy today.

ETF AUM: More than half of all inflows into gold ETFs have been absorbed over the past three months, as a wide range of investors, from wealth/RIA accounts to institutionals, boosted their exposure.
The speed of this build-up has been astonishing: the AUM of U.S.-listed spot-gold ETFs has nearly doubled since February (Goldman had warned of this trend back in June).

Option ETF: Open interest in GLD options has reached an all-time high.

Futures Volume on COMEX: Total volume hit “only” 565,000 contracts (not a yearly high at the time of writing) versus a 375,000 average, since most positioning has shifted toward ETFs.
China: China outperformed on the downside, as the SHFE/CMX arbitrage spread widened to +$12/oz.

www.bankingnews.gr
While global markets appeared relatively calm, the metals market — and especially gold — experienced chaos, with movements described by Goldman Sachs as “bizarre.”
The Goldman Momentum Pair Index collapsed by 5%, with the Momentum Long index dropping 3% and Momentum Short surging 2%.
Yet even those moves paled in comparison to the crash in gold, which plunged as much as 6.3% — a 5-sigma event marking the sharpest fall in over a decade — while spot silver sank 8.7%.
According to Goldman, “the gold chart looked like a collapsing meme stock.”
Gold-mining stocks also tumbled sharply, with major producers such as Barrick Mining, Newmont, and Agnico Eagle Mines falling by more than 8%.
It all came suddenly
The drop came out of nowhere, halting a powerful rally that had pushed both metals to record highs the previous week.
Gold had soared on bets that the U.S. Federal Reserve would deliver at least one major rate cut by the end of the year, and due to the ongoing “debasement trade”, in which investors flee government debt and currencies to shield themselves from runaway fiscal deficits.
However, since none of those fundamentals have changed — and with the debasement cycle only just beginning — the upward trend is likely to resume soon. U.S. total debt has just reached a record $37.98 trillion, rising by $10 trillion in less than five years.
What happened
Adam Gillard, a commodities specialist at Goldman Sachs, explained that gold first moved lower during China’s trading session (with total open interest on the SHFE dropping by 1%) before triggering stop losses as London and U.S. markets opened.
What’s most remarkable, Gillard said, is that there was “no apparent cause” for the crash; though, rarely during gold’s upward trajectory was any move linked to a specific “headline.”
Instead, it was a continuation of the debasement theme, making it difficult to pinpoint a single trigger for the correction.
Gillard’s best explanation for the largest percentage move in a decade is simple: positioning. The market had just come off nine consecutive weeks of gains.
Goldman’s shocking findings
On days when gold rose about $50 an ounce, “we barely got any questions,” Gillard noted.
Gold had become the favorite long macro trade among Goldman’s clients; in multiple client surveys, over 80% expected the price to rise further by year-end (including Goldman’s own traders).
The bank also observed an increasing number of non-commodity accounts taking positions; not surprising, given the surge in demand for physical gold.
All this made a correction virtually inevitable, according to Goldman (and its partners at SpotGamma, who had warned that such a pullback was coming).
Still, similar to the recent collapse of the overleveraged crypto sector two weeks ago, Goldman believes that as gold climbed higher, more investors were left out but wanted in — meaning the bank expects fresh inflows once signs of stability emerge. For that to happen, however, the $4,000/oz level must hold.
Here are the three shocking charts that explain how we got here:
ETF Volume: The ease of using ETFs for fast exposure to gold was fully on display. At current closing prices, GLD accounts for 8% of total U.S. ETF trading volume — the highest share ever in Goldman’s data. Flows at Goldman’s ETF desk were clearly selling-heavy today.
ETF AUM: More than half of all inflows into gold ETFs have been absorbed over the past three months, as a wide range of investors, from wealth/RIA accounts to institutionals, boosted their exposure.
The speed of this build-up has been astonishing: the AUM of U.S.-listed spot-gold ETFs has nearly doubled since February (Goldman had warned of this trend back in June).
Option ETF: Open interest in GLD options has reached an all-time high.
Futures Volume on COMEX: Total volume hit “only” 565,000 contracts (not a yearly high at the time of writing) versus a 375,000 average, since most positioning has shifted toward ETFs.
China: China outperformed on the downside, as the SHFE/CMX arbitrage spread widened to +$12/oz.
www.bankingnews.gr


Σχόλια αναγνωστών